What do ducks have to do with revenues from solar?
Solar is probably going to become our core renewable electricity generation technology. It's simple, it works in lots of situations, and it's getting cheaper. One challenge we need to face up to is 'too much of a good thing', when our solar panels all produce their maximum output at the same time
Summary: Solar is probably going to become our core renewable electricity generation technology. It's simple, it works in lots of situations, and it's getting cheaper. One challenge we need to face up to is 'too much of a good thing', when our solar panels all produce their maximum output at the same time, pushing spot electricity prices down close to zero.
Why this is important: While the marginal cost of producing the extra unit of electricity from a solar panel is very low (the raw materials are free), the upfront capital cost is not trivial. Investors still need to earn a fair return on their investment, or the money will not flow. And financial return is harder to deliver if revenues frequently head toward zero. The Duck curve helps us to understand this, and it helps us start to think about solutions. And be assured, solutions do exist.
The big theme: The twin aims of 'electrify everything possible' and 'make our electricity green' lie at the heart of most countries plans to achieve net zero and to decarbonise their economies. But, delivering on this is not just a case of building more wind and solar (plus geothermal and hydro). Our current electricity grid, and how we manage our electricity flows, is based on a system that Thomas Edison (arguably the father of electricity for all) would recognise, and he died in 1931. There are a lot of changes coming, which we need to anticipate and plan for. The electricity grid of the future will look very different.
And before you ask - yes, there are ducks involved. A useful tool in understanding what higher levels of solar generation can mean for the demand for electricity from other sources is called the duck curve. And yes, it does look a bit like a duck.
In some countries/regions there is so much solar generation during the sunny part of the day, that very little other electricity supply is needed. And this is going to happen more and more. This might sound like a good thing. After all solar is low carbon, just the type of electricity we need more of. And it is good, but this also creates challenges.
The first one we already know - too much solar supply can, if not properly managed, push the price that the solar generating company gets down close to, or even below zero. This is something that many states in Australia are very familiar with. The other challenge is that the steep ramp up in supply needed in the early evening puts real pressure on grid stability.

The Detail
Why this is important
If we are going to use renewables, especially solar, to decarbonise our electricity generation system, we will need a lot more of them. We need to massively scale up from the c. 12% of (global) electricity generation we saw in 2022, to closer to 65-70%. For that to happen, investors and companies need to believe that investing in renewables makes good long term financial sense.
The easier bit of that analysis is the cost to build, and the expected total demand. But, what price will solar electricity sell at ? If it's too cheap, we cannot expect investors to earn a fair financial return - which means not enough new capacity will get built (or subsidies for ever).
Obviously, this is a valid question for all types of electricity generation. But, its especially relevant for solar. When the sun shines, which happens in some parts of the world very regularly, all solar panels will generate electricity at the same time. As we build more solar generation capacity, we will end up with more electricity than we need in the middle of the day, and potentially less at night. And as economists remind us, if we have more supply than demand, prices fall.
What is the duck curve and what does it have to do with solar?
Let's start with what the Duck Curve is; it shows the difference between electricity demand and the amount of available solar energy throughout the day. The best way to think about it is:
how much electricity is needed from sources other than solar to allow demand to be met, and how quickly do those other sources need to ramp up
It makes more sense if you look at it graphically. This is the original California example - the lines show net load (which is total electricity demand minus solar generation). The top grey line shows the situation in 2012, when the amount of solar generation on the system was low. Electricity demand grew through the early morning to a peak around 11am, declined a bit through the afternoon, and then peaked again in the early evening.
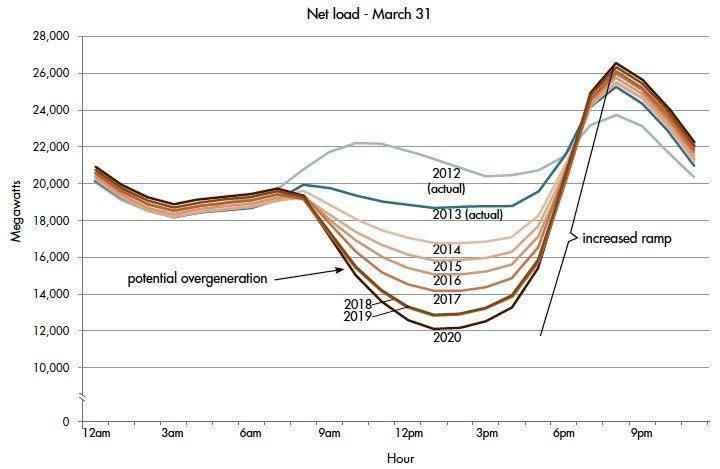
The lower brown lines are forecasts (from 2013/14), and they show that as more solar generation gets built, the electricity system operator expected more of the electricity demand to be met by solar. No surprise here - the marginal cost of producing electricity with solar is very low, so we will use it first.
What does the duck curve tell us?
There are two things I want to draw your attention to. The first one is how steeply the curve rises from about 4pm or 5pm. Ramping up electricity generation quickly like this brings material challenges.
But, it's the second point that is really interesting for this blog. Look how much of the electricity demand that is met by solar in the middle of the day. You don't need much imagination to see that if we add even more solar, supply could end up being greater than demand. And that is not good for pricing.
And you can see the duck more clearly in this chart.
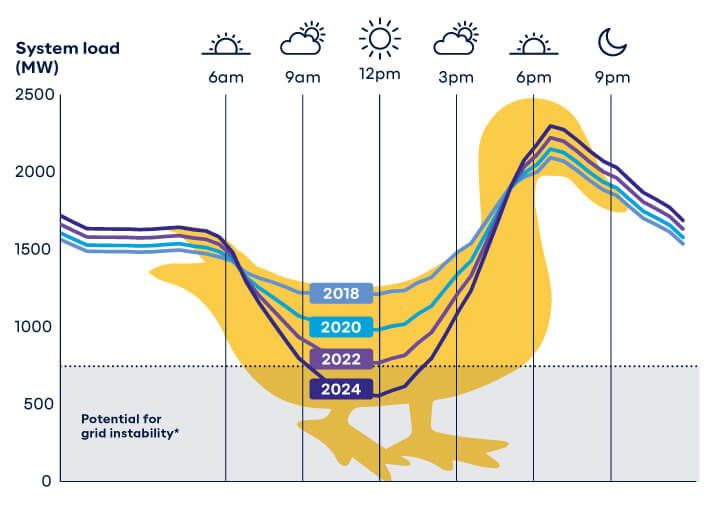
The concept has been known for some time (I first read about it in 2014), but with more countries and regions rapidly adding solar, it's becoming more important to more countries.
What is the impact on price?
Good question. We are talking here about the price the electricity generating company receives. Not the price that the end user pays. This second price is driven by a whole lot of factors, including how most electricity grid operators source electricity (if you want to understand this better - this article is a good place to start - we will write about this some more in a future blog). End user prices are always higher than the price the electricity generator gets.
Let's shift from California to Australia. Some states in Australia have a lot of solar, including roof top solar on residential properties. The chart below shows, for the states of South Australia and Victoria, what percentage of what are known as dispatch periods had negative prices. This means that the electricity generator paid for the grid to take their electricity.
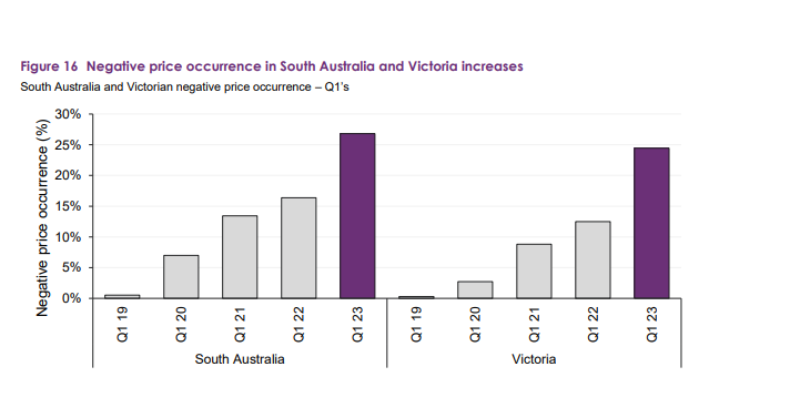
Look carefully, the chart is telling us that for 27% of dispatch periods in South Australia and 24% in Victoria, the price the electricity generator receives is negative. This does not make for great solar economics.
We have solutions!
We need to keep this in context. None of this is a reason not to build more solar generation. We should be using more of the cheapest resource. But, we also need to understand the new challenges more solar will bring. And start to invest in the solutions.
What do the solutions look like. First, we have interconnectors. They take surplus electricity to regions where prices are higher. Because they are in a different time zone (where the sun is not shining) or they don't have cheap solar.
 Sandy Jayaraj
The second big one is battery storage (yes other types of electricity storage are being developed, but they are currently niche). They can buy electricity when its cheap (solar the middle of the day) and they sell it back to the grid when prices rise again (the evening peak in the duck curve). At present most battery storage projects are not being used for this, but this load shifting application is growing. We used to think that batteries only worked for short storage periods, say two hours. But we are already seeing eight hour storage batteries. Watch this space.
Steven Bowen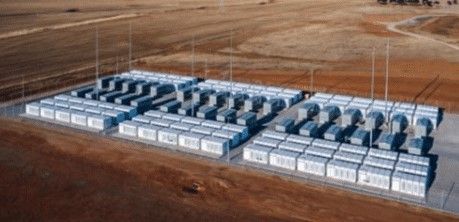
Something a little more bespoke?
Get in touch if there is a particular topic you would like us to write on. Just for you.
Contact us
Please read: important legal stuff.